


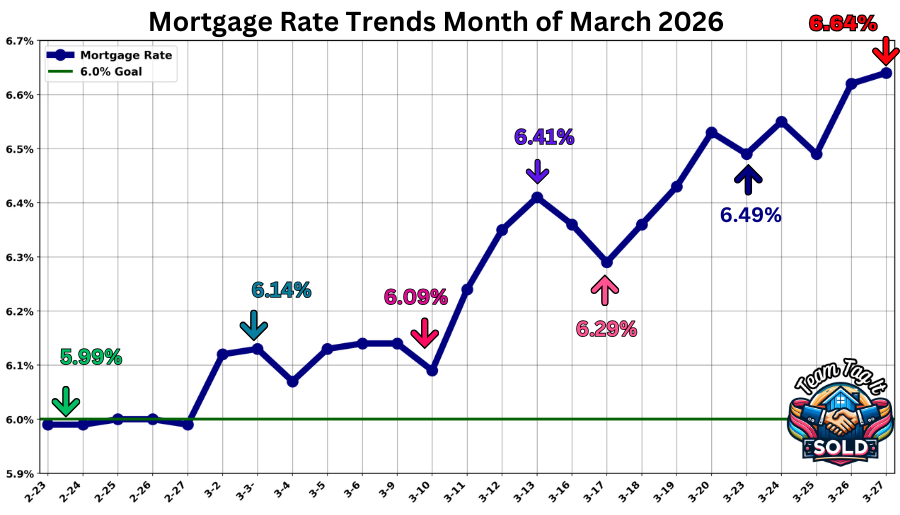
Step 1: WHY the Yield Spiked – Where we were 📈
The Strait of Hormuz is restricted. Iran has 10 days. That’s the headline—but markets don’t wait. They react now. ⚠️ When energy slows, shipping tightens, and insurance disappears, global money moves fast. Until risk is cleared, routine shipping doesn’t return—and that pressure hits immediately.
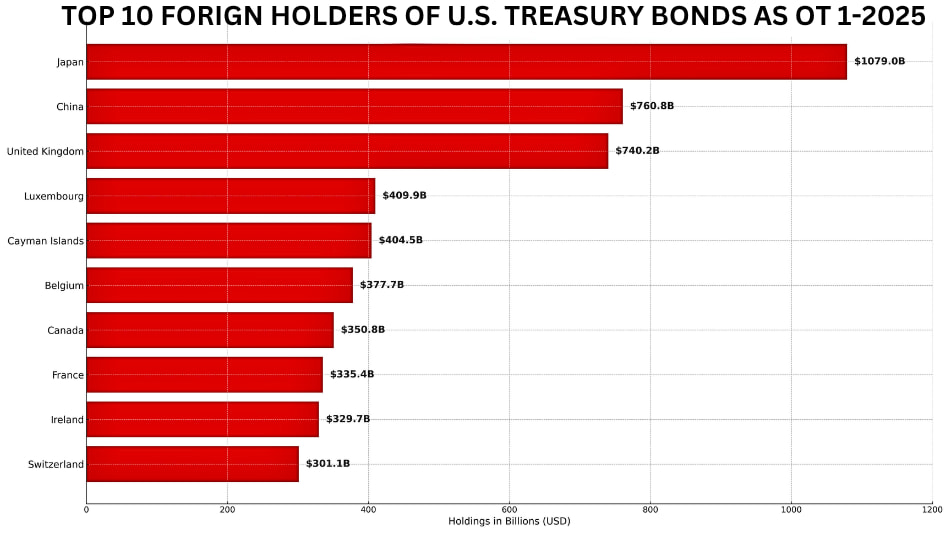
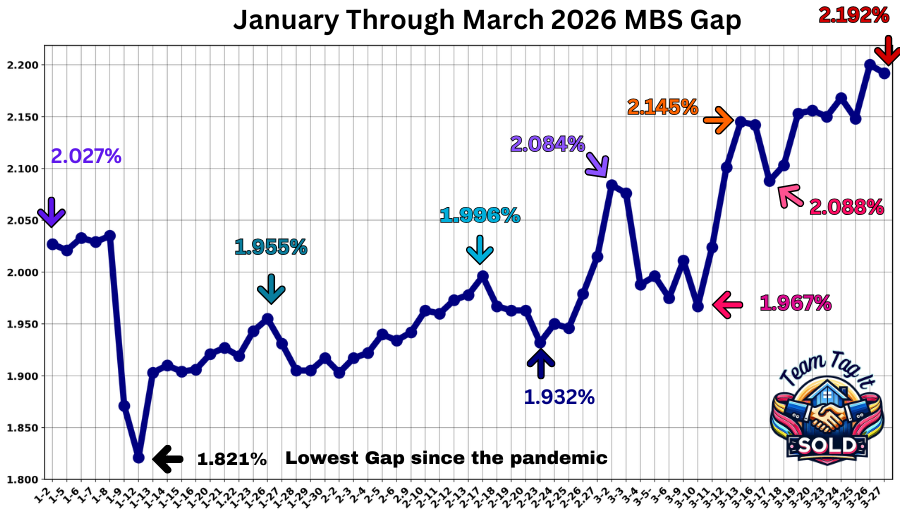
That’s what drove last week’s spike. It wasn’t noise—it was capital repositioning inside the bond market under stress. 🌍 Foreign investors—not Wall Street—led the move. Japan 🇯🇵, China 🇨🇳, and global funds adjusted their exposure and demanded higher returns. That selling pressure pushed the 10-year Treasury yield higher 📈 while UMBS prices moved lower 📉. That spread shift is the mechanism—and as always, where the yield goes, mortgage rates follow.
⚠️ Warning: We may see a slight drift down on Monday based on headlines, but this setup hasn’t cleared. If global pressure builds again, expect another round of bond selling, higher yields, lower UMBS prices, and mortgage rates moving up just as fast.


More Help Is 1️⃣ Click Away⤵️
Pick Your Topic by Scrolling

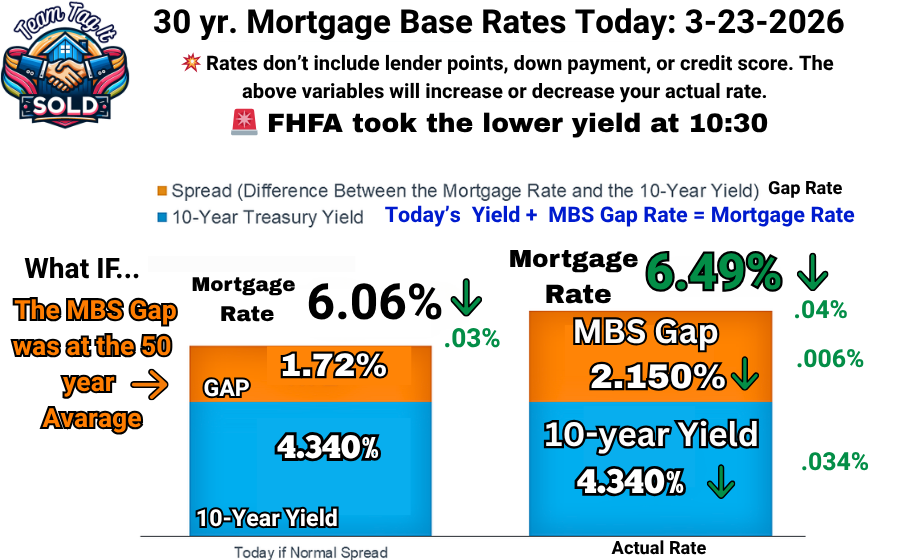
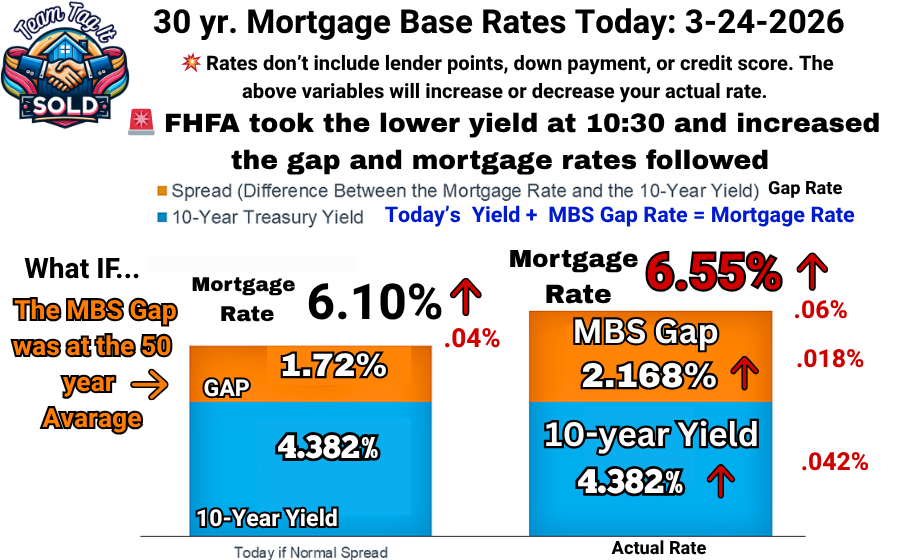
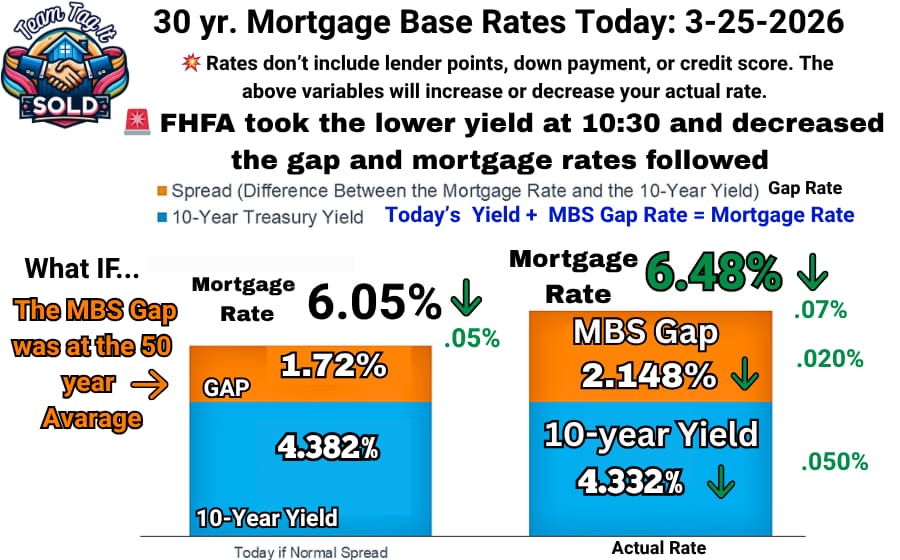
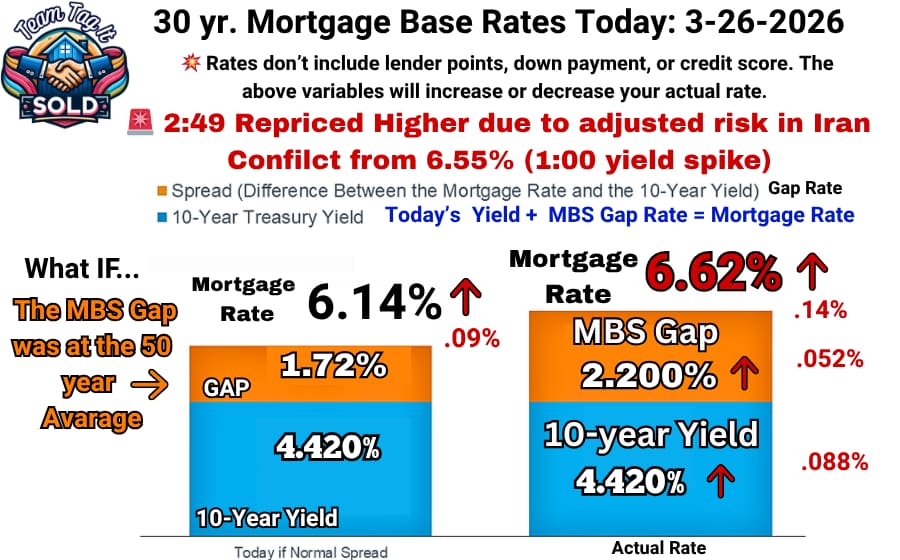
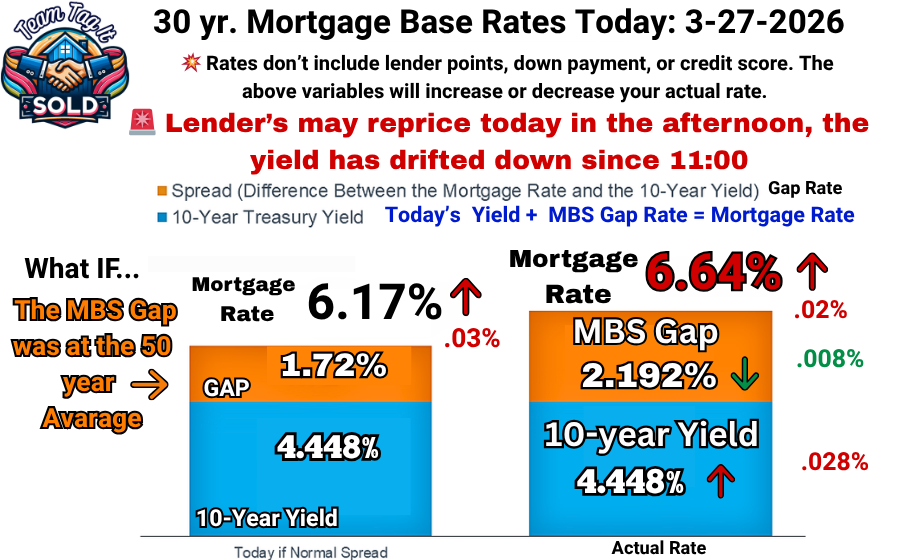
Today’s Mortgage Rates: What’s Driving the Change 📈📉

Crack the Mortgage Rate Code: Know the WHY and Save💲

Open Houses this Week in Metro Detroit MI – Live MLS Data🏘️🔍

The Home Price You Pick Can Make or Break Your Sale 😱🏡

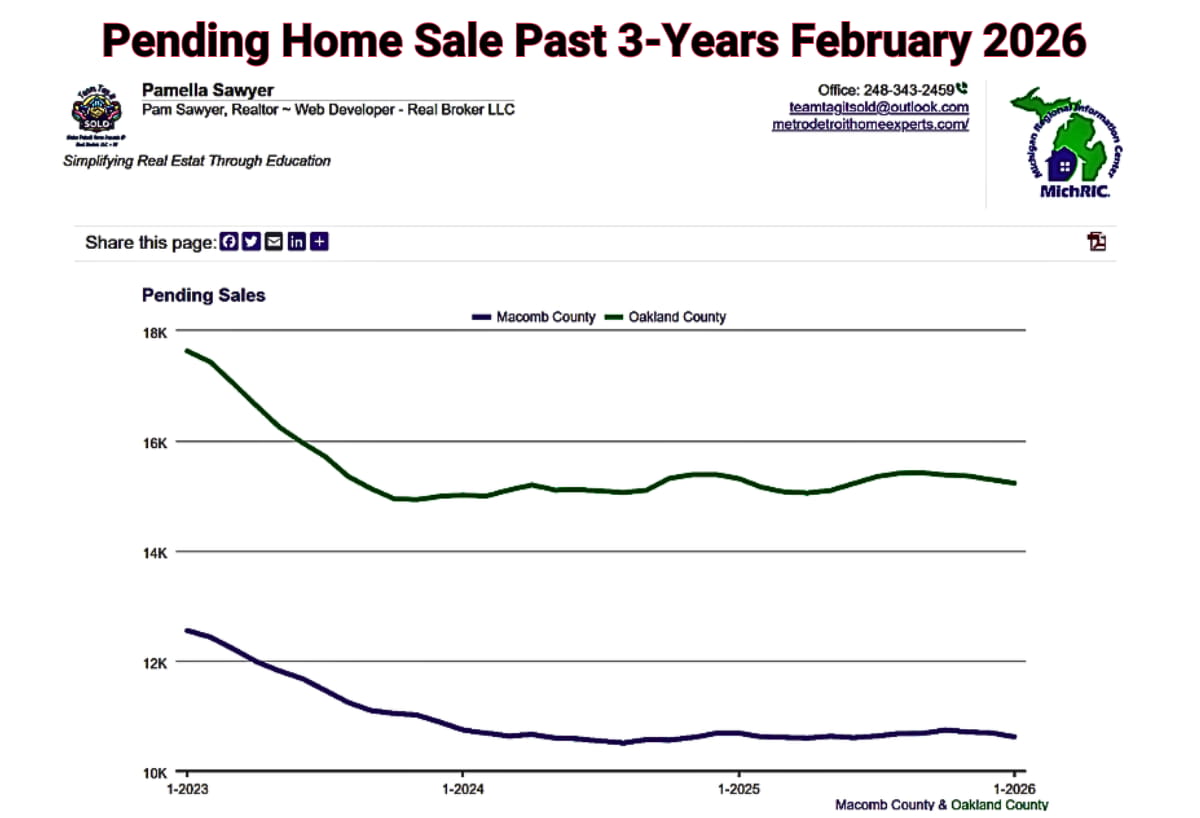
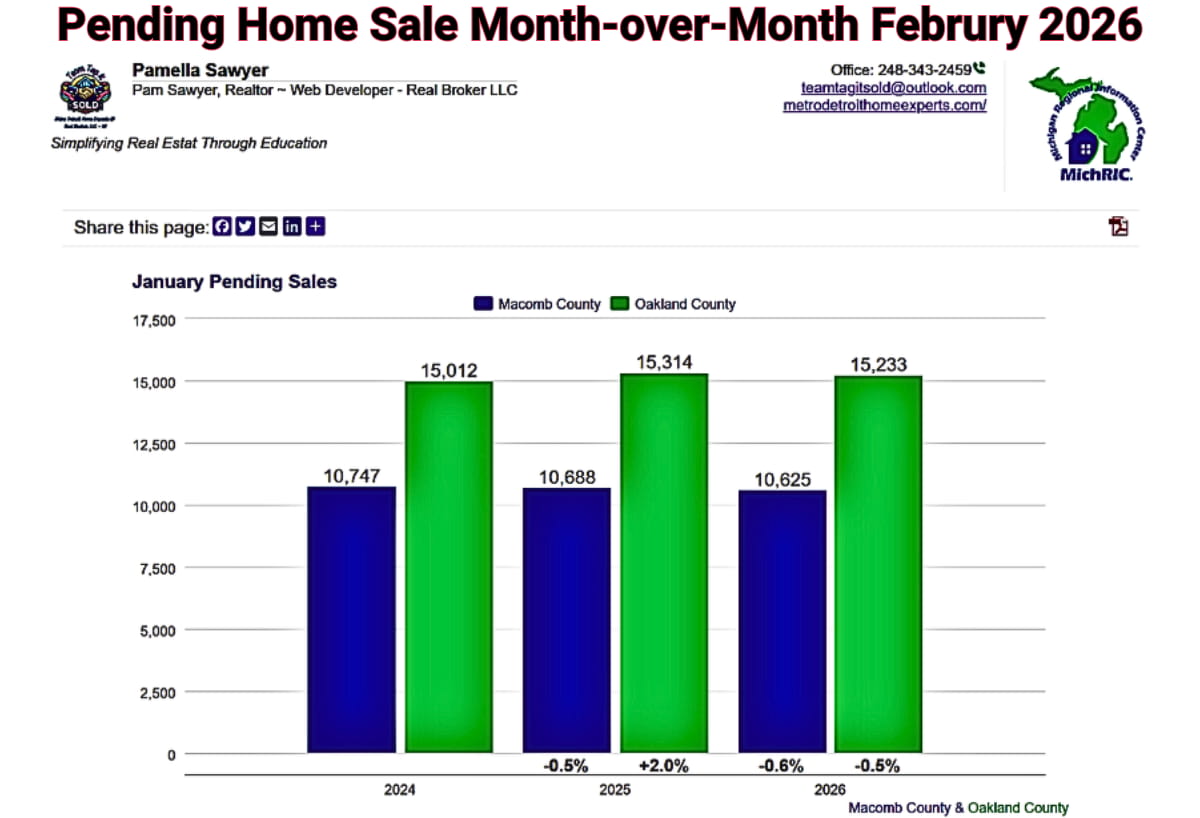
Metro Detroit Housing Market Trends Decoded – March 2026📈📉

Are More Homes for Sale A Warnining⚠️ or Opportunity💡

Are Home Prices Dropping in Metro Detroit❓Let’s Find Out 📉🏠

The First-Time Home Buying Blueprint: 3 Steps That Matter

Your House Isn’t Getting Offers❓ Find Out Why 💡

#1 Reason Home Buyers Walk Away – How To Fix It 🏃➡️

Foreclosed Homes for Sale – Is a Wave Coming ⛈️🏘️

Metro Detroit MI Housing Market Trends by City -March 2026🔍📊

Thinking of Selling Your House: How Long Will It Take?

Hiring a Realtor Vs. Going Solo When Selling Your Home ✨🤷♀️

Your Home Didn’t Sell: Let’s Fix That! 🔄🏡

Home Projects That Boost Value When You Sell👏💲

Mistakes Home Buyers Make Today: How to Avoid Them😨🏡

Seller Concessions: Types of Concession a Buyer May Ask For 💡

Biggest Mistakes Home Sellers Will Make This Spring 2026😲💰

When Interviewing Mortgage Lenders Ask these Questions First 📃
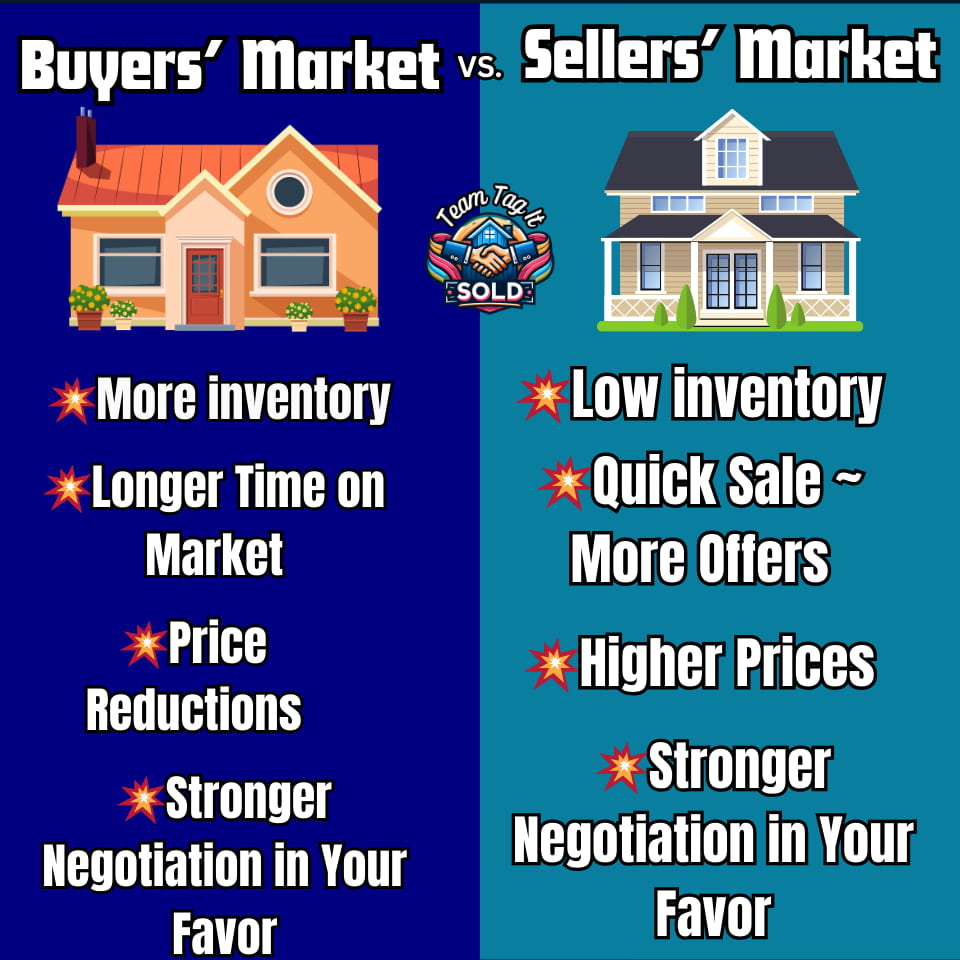
Buyers vs Sellers Market 🎯Tale of Two Housing Markets🏘️

How a Veteran Home Loan (VA) Can Help You Buy a Home🤩

Homeowners Association (HOA): What Buyers Need to Know📜💡

Common Real Estate Terms Explained for Metro Detroit

Mortgage Mistakes to Avoid After Applying🏡😱

Selling Your House As-Is OR Make Repairs Pros🌟 and Cons🚫

Mortgage Pre-Approval: Your Secret Power 🎓💲

Fixer-Upper Homes for Sale: See the Hidden Benefits 👀

Home Value Vs. Price Driven Approach to Home Pricing: Myth Busting Revealed 🤫⛓️💥